This blog post is the work of Hongkai Li, edited by Tolmachev Arseny. The authors belong to Works Applications and are working for RevComm.
.
TL;DR
We tried different summarization metrics with four datasets and summarization models. Our findings are:
- Relevance metrics give different results from factual consistency metrics.
- Some metrics, especially factual consistency metrics, perform differently between dialogue summarization and conversational summarization.
- It is essential to choose different metrics according to the purpose of the evaluation, especially from the industrial perspective.
- Many metrics are not easy to adapt to other languages, especially those that require fine-tuning models.
Background
During the development of summarization systems, we need to measure the performance of the system and compare it to different systems. We use various performance metrics for this. Probably, the most important direction to compare is the quality of summarization itself. In this blog article, we give a very brief overview of several summarization evaluation metrics and our experiments on evaluating those metrics with a focus on summarizing dialogues.
We investigated various existing summarization evaluation metrics, focusing on relevance and factual consistency, across several systems and datasets by comparing the scores and correlations between each other. Here, we would like to share our results and findings.
Document summarization is the process of reducing the size of a document while keeping the main concepts. ROUGE and BLEU are widely used as evaluation metrics for the summarization task. ROUGE and BLEU do not capture paraphrased expressions (same meaning but different words). Several scores have been proposed in recent years to address this issue. Most proposed scores are word-based methods such as BERTScore. However, other methods have been proposed for the past three years. For example, there are evaluation methods using information extraction and question-answering.
Evaluation Metrics
There are a lot of aspects for evaluating a summary, such as coherence, consistency, fluency, and relevance, as suggested in this article and this article. Most works focus on relevance or/and (factual) consistency.
Relevance measures how well the summary captures the key points of the source document. It focuses on whether all and only the important aspects are contained in the summary. The key points are usually included in reference summaries. So, relevance scores are usually calculated with system summary and reference summary pairs.
Factual consistency is defined as the factual alignment between the summary and the summarized source. A factually consistent summary contains only statements that are entailed by the source document. So, factual consistency scores are usually calculated with system summary and source text pairs.
The example below describes the two very well. The summary in the first row fails in relevance, and the second has a factual error.
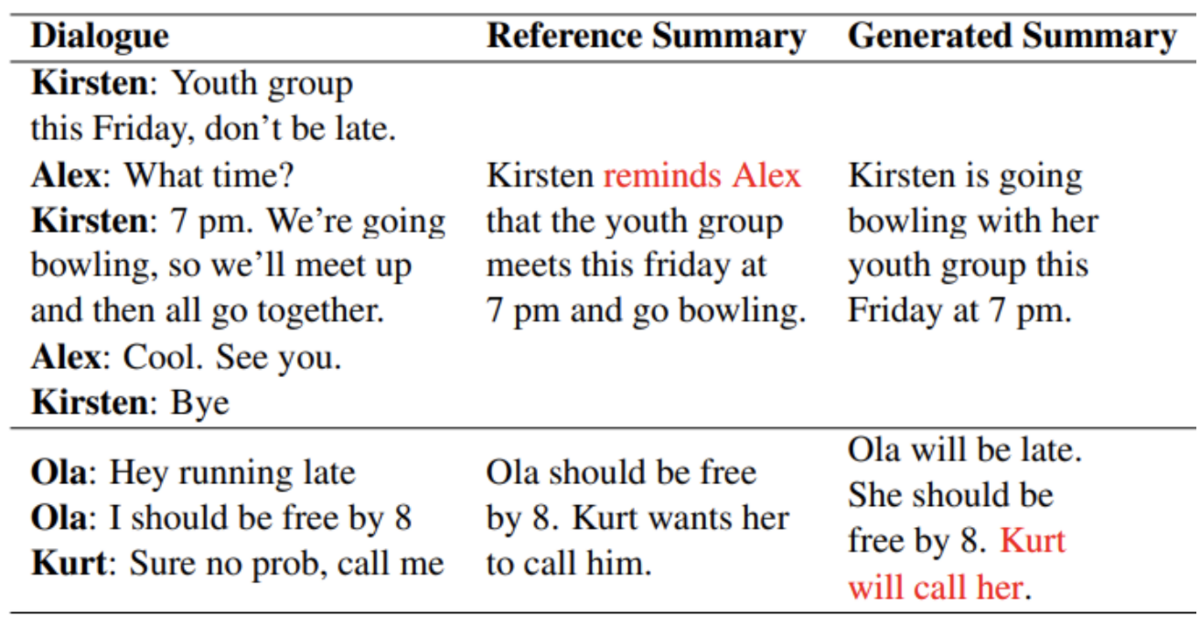 Figure 1. Examples of relevance and factual consistency errors (source)
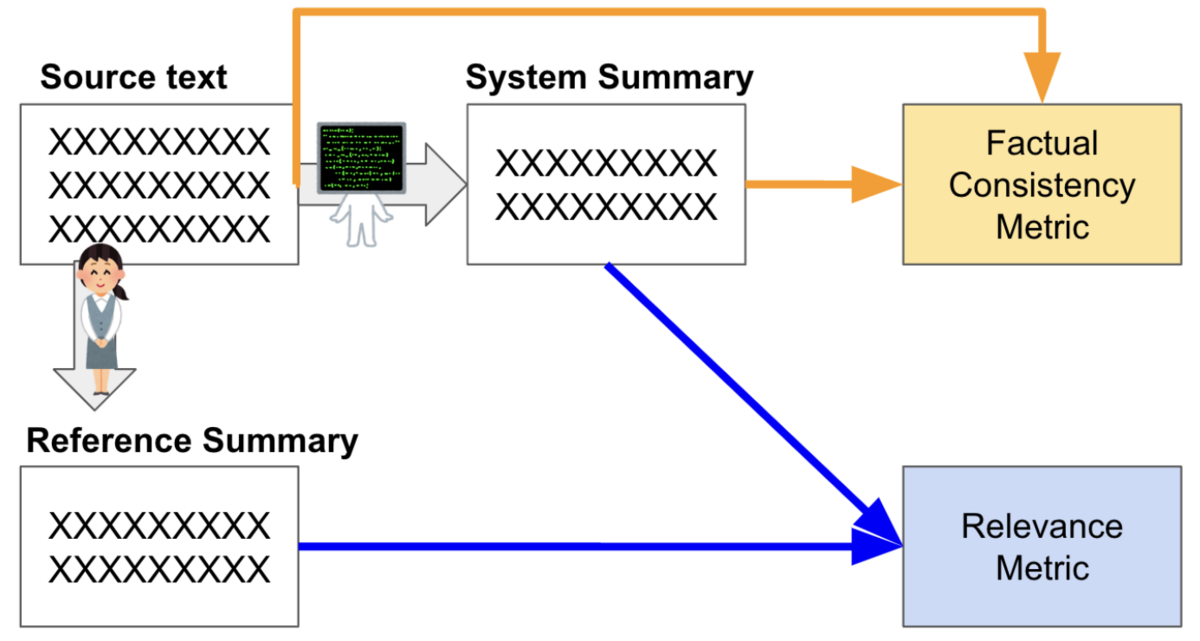 Figure 2. Difference between relevance and factual consistency metrics (source)
For years most papers have been using ROUGE to measure summaries. Recently, especially since 2019, researchers have focused on factual consistency of summarization. LLMs such as ChatGPT further contributed to this trend because there are often hallucinations in their outputs.
So, we focused on both aspects and chose the existing evaluation metrics listed below. A very brief description of those metrics is provided in Figure 2.
Table 1. Relevance metrics
| Metric | Japanese? | TL;DR |
|---|---|---|
| ROUGEcode | Perfect | Exact n-gram overlap (ROUGE-n) or longest common sequence (ROUGE-L) between 2 texts (e.g. summary and reference) |
| BERTScorecode | Yes, needs BERT model | Calculate similarities between 2 sentences and get recall and precision scores using contextual embeddings from a pre-trained BERT model. |
| MoverScorecode | Yes, needs BERT model | Extension of BERTScore that uses hard alignments between sentences. With Word Mover Distance (WMD) developed from Earth Mover Distance (EMD), MoverScore finds the minimum effort to transform a text to the other to get soft alignments. |
| BARTScorecode | Maybe, needs fine-tuning | Weighted log probability of one text given another text |
Table 2. Factual consistency metrics
| Metric | Japanese? | TL;DR |
|---|---|---|
| OpenIE *code | Maybe. needs a Japanese entity relationship extractor | Extracts triples from both the summary and source document and evaluate whether the triples of the summary are included in those of the source document |
| FactCCcode | Maybe. Needs data or data generation scripts. | FactCC: A classifier to judge whether a summary is factually consistent with the source document.FactCCX: I think the X means explanation, meaning this model is able to explain why the summary is wrong. |
| DAEcode | Maybe, needs Japanese dependency parsing and model training. | Dependency Arc Entailment. DAE views dependency arcs as semantic units and each arc is judged independently based on whether the relation it implies is entailed by the source sentence. |
| QAGS *code | Maybe, needs Japanese QA and QG models. | QAGS is based on the intuition that if we ask questions about a summary and its source, we will receive similar answers if the summary is factually consistent with the source. |
| CoCocode | Maybe, needs BART | CoCo selects key tokens in summary and masks the tokens in the source document. The masked source document is then fed to the scoring model. If the scoring model is still able to generate the masked token with a high possibility, it means that the token is more likely to come from the scoring model instead of the source document. Therefore a penalty should be added. |
| SummaCcode | Maybe, needs training/fine-tuning | Sentence level alignment. |
| FactGraphcode | Maybe, needs Japanese AMR | FactGraph uses abstract meaning representation to form the graph of a sentence and then uses the model above to give the final score. |
* For OpenIE and QAGS, we use the implementation from a toolkit called FactSumm .
Experiments
Datasets and Systems
We conducted experiments on the following datasets and systems. The aim of the experiments is to
- Investigate the advantages and disadvantages of each metric
- Compare the results between relevance and factual consistency-focused metrics
We used the following datasets for the experiments.
- Samsum dataset contains instant messenger-like conversations with summaries. Conversations were created and written down by linguists fluent in English.
- CNN / DailyMail Dataset (CNNDM) is an English-language dataset containing just over 300k unique news articles written by journalists at CNN and the Daily Mail.
- XSUM consists of online articles from the British Broadcasting Corporation (BBC) and single-sentence summaries. Specifically, each article is prefaced with an introductory sentence (aka summary), which is professionally written, typically by the article's author.
- DialogSum consists of three public dialogue corpora, as well as an English speaking practice website. These datasets contain face-to-face spoken dialogues that cover a wide range of daily-life topics, including schooling, work, medication, shopping, leisure, and travel.
Table 3. Dataset summary
| DialogSum | Samsum | CNNDM | XSUM | |
|---|---|---|---|---|
| Num. of documents in the train dataset | 12,460 | 14,732 | 287,113 | 204,045 |
| Num. of documents in the test dataset | 1,500 | 819 | 11,490 | 11,334 |
| Num. of tokens in a source document | 210 | 157 | 868 | 487 |
| Num. of tokens in a summary | 35 | 26 | 66 | 26 |
| Compression Rate | 17.80% | 21.40% | 9.20% | 9.50% |
Table 4. Scope of experiment; ”o” means the target
| Dataset\System | ChatGPT | GPT3 | Flan-T5 | T5 |
|---|---|---|---|---|
| Samsum | ○ | ○ | ○ | ○ |
| CNNDM | ○ | - | ○ | ○ |
| XSUM | ○ | - | ○ | ○ |
| DialogSum | ○ | - | ○ | ○ |
For Flan-T5 and T5, we either used existing fine-tuned models or fine-tuned flan-t5-large or t5-large with the datasets by ourselves. The models used for the Samsum dataset are:
Results
Correlation Among the Metrics
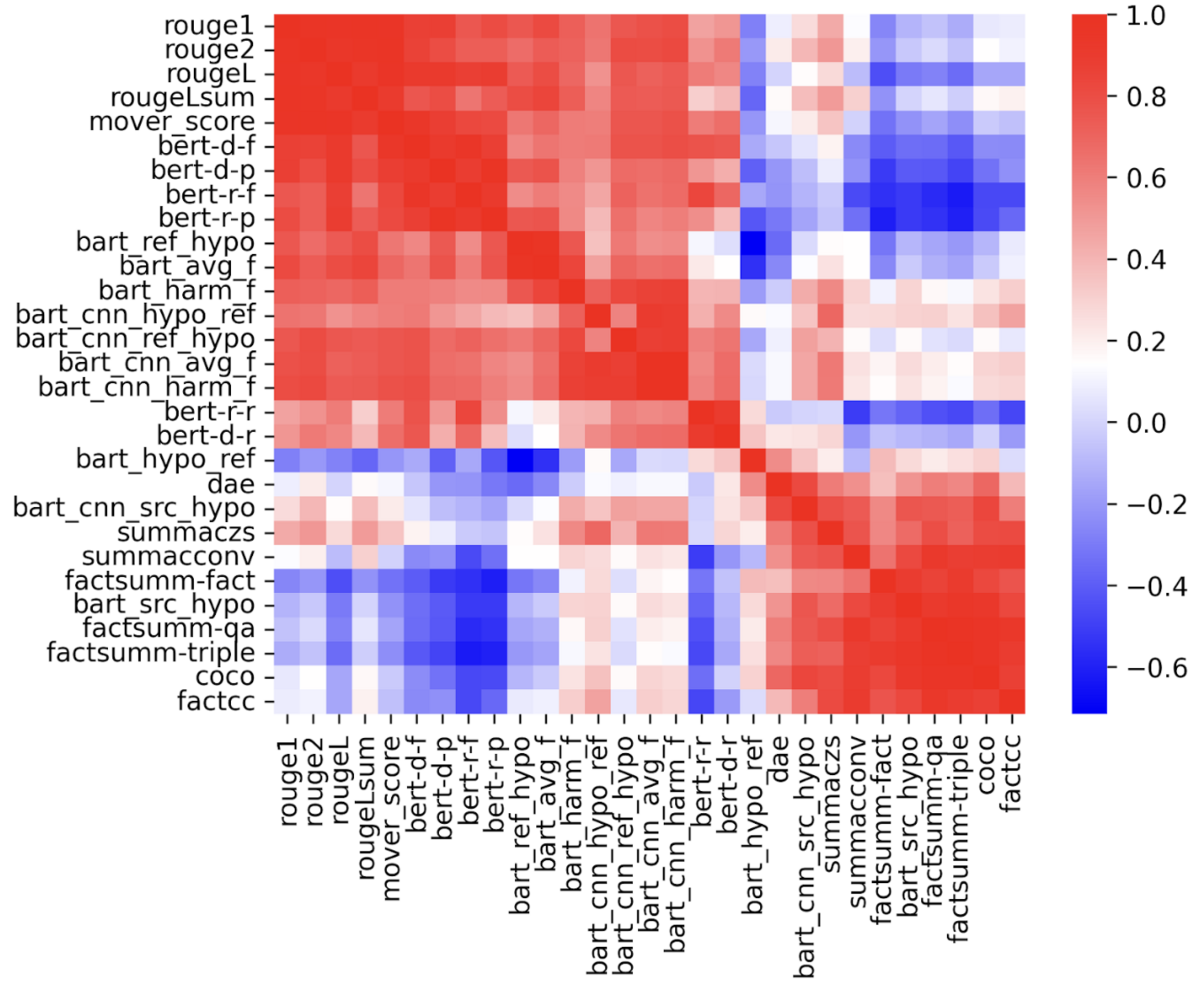 Figure 3. Heatmap of Pearson correlation among the metrics
Figure 3 shows the Pearson correlation among the metrics. Metrics from rouge1 to bart_hypo_ref are categorized as relevance metrics, and metrics from dae to factcc are factual consistency metrics. We can clearly see that relevance metrics correlate with each other while having a low correlation with factual consistency metrics, except the bart_hypo_ref score. Factual consistency metrics only correlate with factual consistency metrics as well.
For relevance metrics, some metrics have precision, recall, and F1 scores. We can find recall scores (bert-r-r, bart_hypo_ref, etc.) have a relatively low correlation with precision scores (bert-r-p, bart_ref_hypo, etc.). In most cases, the ROUGE scores seem enough to reflect the performance at the system level.
The low correlation between retrieval and factual metrics can be explained because they focus on different aspects. Sometimes, a summary may get a high relevance score because it is extremely similar to the reference summary with only a 1-word difference. However, this word is very important and changes the whole meaning of the summary. Factual consistency metrics are able to capture this kind of error. Additionally, some summarizers may output more information that is not included in the reference summary, but according to the source text, the information is true and consistent. This will also contribute to the low correlation. See the example below.
| Source Dialogue | Rudi: Hetta, did you see the last trump video Henrietta: nope Henrietta: what did he do now? Rudi: <file_video> Henrietta: OMG Henrietta: what a jerk Rudi: it gets worse Rudi: <file_other> Rudi: the whole interview is here Henrietta: can't believe he said that about a congress woman Rudi: yeah Henrietta: do you wonder where the limit is? Rudi: wdym Henrietta: if he will say something that will actually get him kicked out of the white house Rudi: not really Henrietta: fuck Rudi: yeah |
|---|---|
| Reference Summary | Trump is acting like a contemptible fool and it is getting worse. Rudi has sent Henrietta the link to his interview. |
| System Summary | Rudi and Henrietta discuss a video of Trump insulting a congresswoman, and wonder if he will say something that will get him kicked out of the White House. |
| ROUGE LSUM | 0.1632653061 |
| FactCC | 1 |
| CoCo | 0.441158 |
Here, the system summary includes more facts (e.g. White House) than the reference one, so it gets a better FactCC score than the reference one.
Micro Analysis: Relevance-Based Metrics
As mentioned above, the bart_hypo_ref score correlates with neither other relevance metrics nor factual consistency metrics. It is defined as recall, which is the probability of generating the reference summary from the system summary, according to the BARTScore paper. So, we can find it relatively correlates with bert-r-r, bert-d-r, and bart_cnn_hypo_ref.
By investigating and comparing the scores of each sample of different systems, we found that for example, the range of the bart_hypo_ref scores of Flan-T5 with Samsum was (-13, -0.7), while that of ChatGPT was (-8.6, -0.8). As a result, the average score of ChatGPT was higher than Flan-T5, even though Flan-T5 outperformed ChatGPT in other metrics. BARTScore seems very risky because it does not have a specific range.
Micro Analysis: Factual Consistency-Based Metrics
When investigating the scores from DAE, we found that more than 90% of the samples scored more than 0.90 (90%). Take the sample from Samsum below, for example:
The T5 output had only one thing wrong: the neighbors are only Ricky’s new neighbors but not Frederick and Ricky’s.
Since dae is based on dependency arcs, it is relatively easy to understand that most arcs match the source text, so the score was extremely high.
On the other hand, factcc is a binary classifier. If the sentence contains any wrong information, the whole sentence will be false. And since the T5 output only had one sentence, the final score was 0.
The factsumm-qa is based on facts (QA pairs) extracted from the source text and the system summary and can recognize that some parts of the sentence are true while some are false.
This remains a problem whether we should allow partially correct summaries or reject summaries containing any false information (factcc vs. factsumm-qa).
Evaluating Factual Consistency of Reference Summaries
Factual consistency-based metrics calculate scores with the source document and system summary pairs, while relevance-based metrics use system and reference summary pairs. We are pretty curious about whether reference summaries can get high scores in factual consistency-based metrics, so we fed some of the evaluators with source documents and reference summary pairs of Samsum corpus. Here are the results.
| Metrics | Ref | ChatGPT | GPT-3 | Flan-T5 | T5 |
|---|---|---|---|---|---|
| FactSumm-src-fact | 0.0122 | 0.0147 | 0.0119 | 0.0142 | 0.0159 |
| FactSumm-src-qa | 0.2786 | 0.2731 | 0.2644 | 0.2963 | 0.3186 |
| FactSumm-src-triple | 0.0348 | 0.0514 | 0.0428 | 0.0739 | 0.1096 |
| FactCC | 22.1 | 21.25 | 27.11 | 21.37 | 18.93 |
| DAE | 95.16 | 93.78 | 91.82 | 93.4 | 94.71 |
| CoCo | 24.64 | 27.7 | 24.82 | 30.61 | 34.55 |
Red = Worst, Blue = Best
Interestingly, reference summaries even got the worst scores in some of the metrics. It may be because the evaluators failed to extract facts from the source document or summary. From this perspective, DAE may be the best or most convincing evaluation metric.
Performance Differences by Dataset
We used four datasets with different properties for our experiments and observed that systems performed differently among the datasets.
ChatGPT’s Behavior
From our observation, ChatGPT tends to output more information than needed to make perfect answers. Regarding summarization, it tends to output longer summaries than other systems. This results in 2 main consequences:
- ChatGPT got relatively higher recall scores, such as the hypo-ref direction of BARTScore, which is defined as ‘recall’ in BARTScore’s paper, and recall scores of BERTScore. And conversely, the precision scores, such as the ref-hypo direction of BARTScore are extremely low.
- ChatGPT got higher factual consistency scores in certain metrics with some of the datasets. Since ChatGPT tends to output more information, and considering ChatGPT’s ability to extract information from the input, the extra information is also consistent with the source text, making factual consistency scores relatively high.
This is especially obvious for the XSUM dataset because each reference for each document is only one sentence. Flan-t5 and t5 models have been fine-tuned with XSUM’s training data, so the two models only produce one-line summaries as well. On the other hand, summaries from ChatGPT always include several sentences, so ChatGPT got relatively high scores in recall and extremely high scores in factual consistency, while other relevance scores were very low.
FactSumm’s Behavior
We have also observed that some evaluation metrics performed differently among the datasets.
Take FactSumm, for example. We got extremely low scores with all systems among all datasets except CNNDM. We consider it was because FactSumm extracts information from source texts and summaries to compare the pairs. Since both source texts and summaries of CNNDM are relatively long and formal, FactSumm can extract more facts from both. When we investigated the results of FactSumm for other datasets, we found that many summaries were scored 0 because FactSumm failed to extract any entity from the data. We consider this as a big disadvantage of FactSumm (or OpenIE, to be precise).
Dialogue vs. Narrative
From our observation, information extraction-based metrics such as OpenIE or DAE failed to extract important information because the person name of the speaker is in the front of their lines. Abstractive summarizers can summarize the lines with the correct speaker name, but extractive methods sometimes fail to recognize that, resulting in low scores.
Below is a simple example of this phenomenon by FactSumm (OpenIE, QAGS):
| Input | Input Source Text | Jack killed John. | Jack: I killed John. (*3) |
| Input Summary Text | Jack killed John. | ||
| factsumm-fact (*1) | Facts | None | |
| Fact Score | 0 | ||
| factsumm-qa | Answers based on SOURCE | [Q] Who killed John? [Pred] Jack [Q] Who did Jack kill? [Pred] John |
[Q] Who killed John? [Pred] <unanswerable> [Q] Who did Jack kill? [Pred] John |
| Answers based on SUMMARY | [Q] Who killed John? [Pred] Jack [Q] Who did Jack kill? [Pred] John |
||
| QAGS Score | 1 | 0.5 | |
| factsumm-triple | SOURCE Triples | ('Jack', 'killed', 'John') | None |
| SUMMARY Triples | ('Jack', 'killed', 'John') | None (*2) | |
| Triple Score | 1 | 0 | |
*1. For factsumm-fact, since both samples got the same results, the details are omitted.
*2. FactSumm only outputs common triples of source and summary.
*3. When we changed the input source text to ‘Jack said that he killed John.’, the results were the same as ‘Jack: I killed John.’
This is considered to be able to be avoided by fine-tuning with dialogue data.